[RETAIL SECTOR]

Intelligent carbon management for retail. Transform your operations with CarbonOS.

With CarbonOS, retail chains reduce emissions, optimise energy in stores and distribution centres, and meet sustainability regulatory requirements.
our expertise
our expertise
CarbonOS dashboard, Carbonova's AI-powered carbon management platform
PROGRAMS & TECHNOLOGY PARTNERS
15
specialised AI agents — from an auditable GHG inventory to carbon per store, channel, and SKU, in a single pipeline.
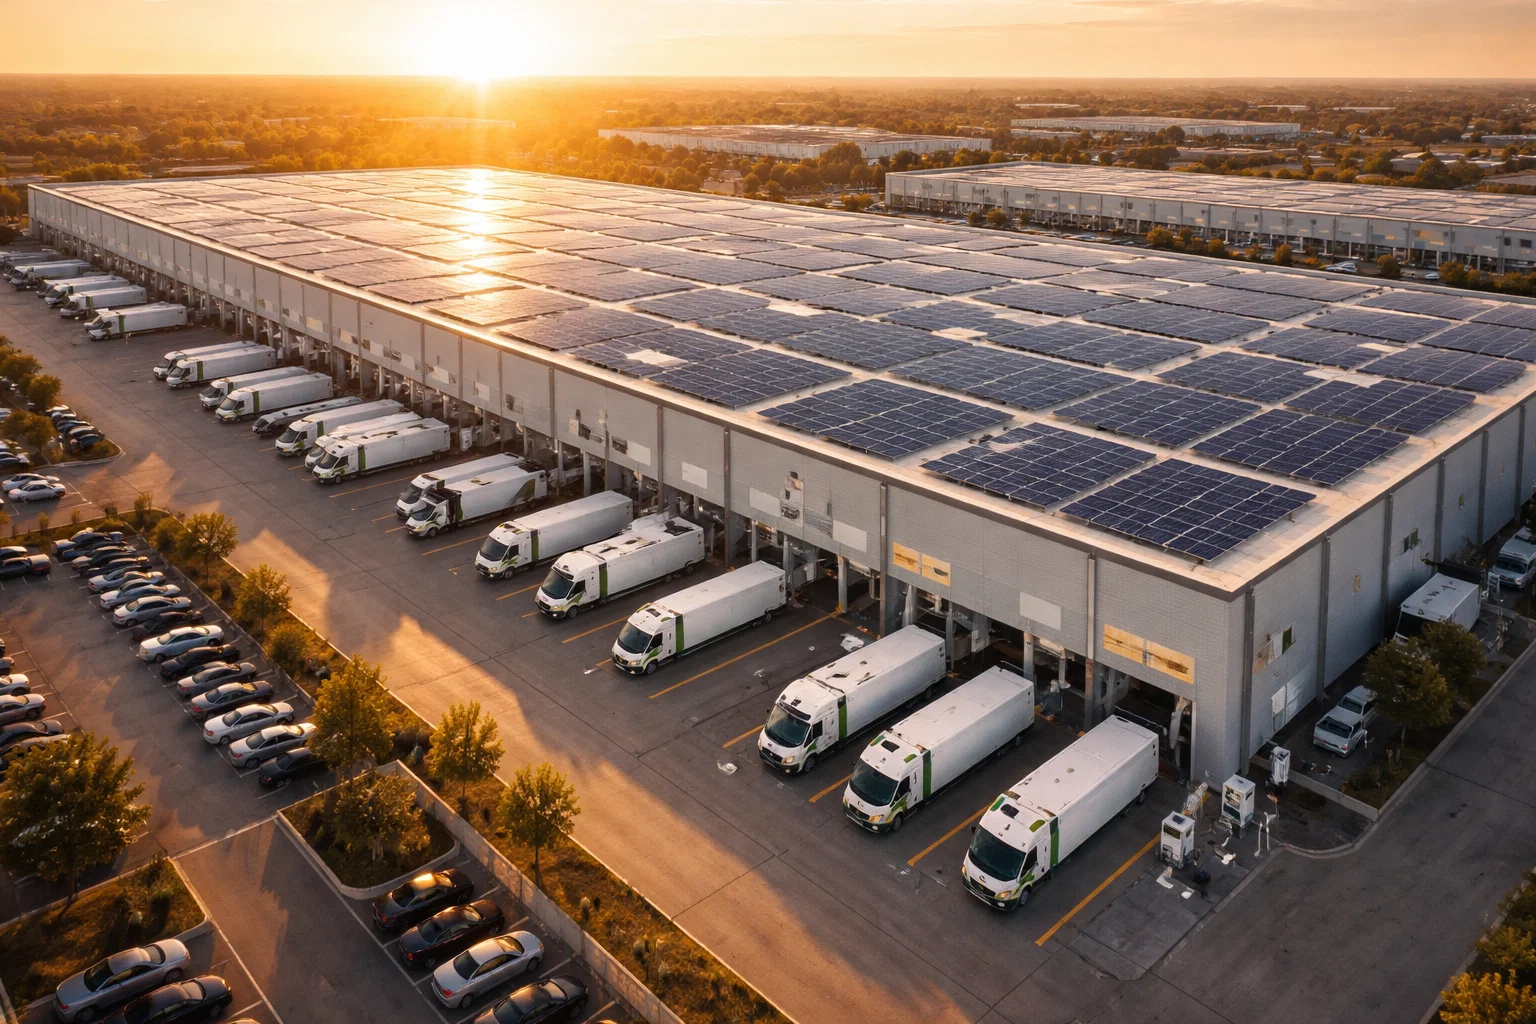
Carbon data visualisation on Carbonova's CarbonOS dashboard
[RETAIL EFFICIENCY]
CarbonOS: AI-native infrastructure for retail carbon management.
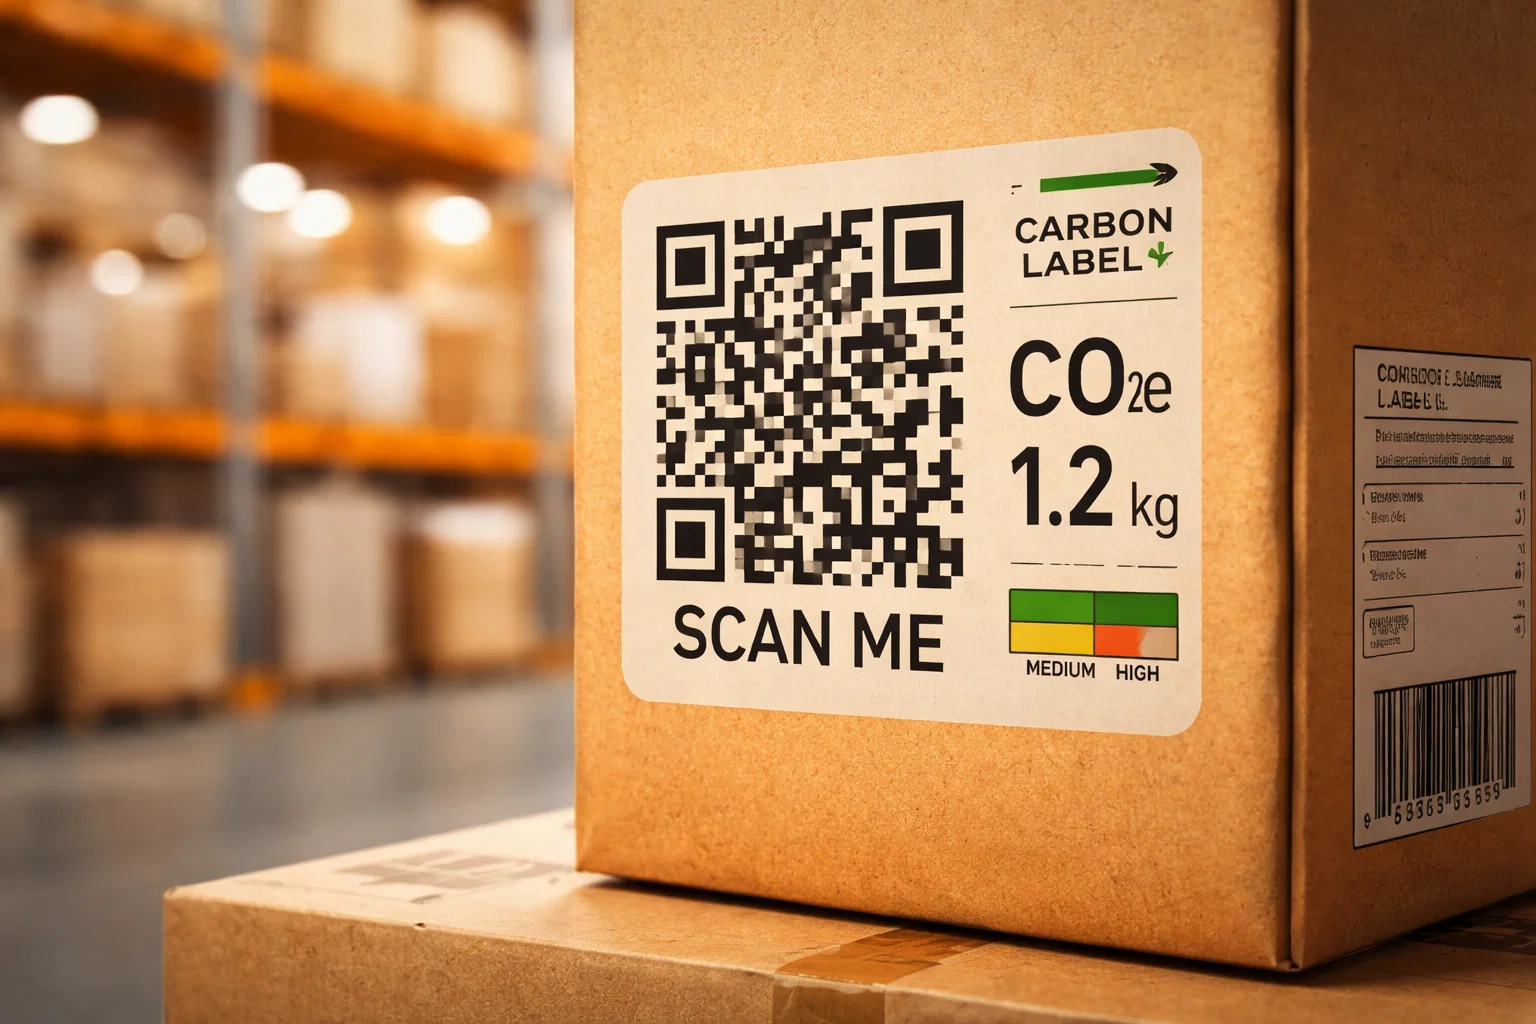
CarbonOS monitors energy consumption across stores, distribution centres, and fleets in real time. The platform delivers insights for reducing emissions at the point of sale, in last-mile logistics, and in commercial refrigeration.
Right arrow iconRight arrow icon
our process
Scope 1, 2 and 3 emissions inventory on the CarbonOS dashboard
Emissions Inventory
CarbonOS control panel for monitoring the carbon footprint
Energy Efficiency
Product Traceability
Emissions report automatically generated by the CarbonOS platform
Sustainable Logistics
[OUR PURPOSE]
Accelerating retail’s sustainable transition with technology, data, and artificial intelligence for low-carbon operations.
Right arrow iconRight arrow icon
our partners
[OUR SOLUTIONS]
Customised solutions for retail sector challenges.
Our specialists work with your team to implement CarbonOS, adapting the platform to your retail chain’s specific needs. From store monitoring to cold chain optimisation, we offer complete solutions for sustainable operations.
Store Management
Cold Chain
Green Supply Chain
ESG Compliance
Carbon Reports
Automated inventory icon
Carbon Credits
CarbonOS interface showing real-time analysis of industrial emissions
SBCE and CBAM regulatory compliance module in CarbonOS
Predictive analysis of GHG emissions on the CarbonOS platform
sustainable
retail
sustainable management
ESG compliance
Companies and partners that trust Carbonova
[Frequently asked questions]

Low-carbon retail with AI: frequently asked questions

Short answers on Scope 3, store energy, refrigeration and carbon rules in retail. To see them worked out with your own chain’s data, book a demo.

Right arrow iconRight arrow icon
book a demo

How does Carbonova help a retail chain cut costs and emissions?

Up arrow icon

Carbonova connects store and distribution centre energy, refrigeration service records, fleet and transport data and merchandise purchases from the ERP to CarbonOS, a platform of AI agents. CarbonOS calculates emissions per store, channel and SKU, flags stores with unusual energy use or refrigerant top-ups and ranks measures by cost and CO₂ avoided, while the supply chain agent works on Scope 3 with suppliers.

Where do a retail chain’s emissions come from?

Up arrow icon

Most of them sit outside the stores, in the goods bought from suppliers and in transport, which make up Scope 3. On average, the supply chain emissions of companies reporting to CDP are 26 times their emissions from direct operations (CDP, 2024). In stores and distribution centres, the main sources are electricity for refrigeration, air conditioning and lighting, in Scope 2, and refrigerant leaks, in Scope 1.

Which carbon reporting rules apply to retailers in Australia?

Up arrow icon

Large companies report under AASB S2, which requires Scope 1, 2 and 3 emissions; Group 2 entities started with reporting periods beginning on or after 1 July 2026, and for a retailer Scope 3, from purchased goods to transport, is usually the largest part. Corporate groups that emit 50,000 tCO₂e or more, or consume 200 TJ or more of energy a year, also report under NGER by 31 October each year.

What can a misleading green claim cost an Australian retailer?

Up arrow icon

For conduct from 28 March 2026, a company that makes a false or misleading representation under the Australian Consumer Law, such as an unsupported environmental claim, faces a maximum penalty per breach of at least $100 million, and more where the benefit gained or the turnover involved is large (ACCC, 2026). Carbonova keeps every emissions figure behind a product or store claim traceable to its source data and emission factor, so claims can be checked before they go out.

How does Carbonova help retailers cut Scope 3 emissions with suppliers?

Up arrow icon

The supply chain agent collects emissions data from suppliers and rates them with risk scorecards, so procurement and sustainability teams can focus on the categories that weigh most. Only four in ten companies engage their suppliers on climate issues (CDP, 2024), and that is where a retailer’s biggest lever sits. The lineage of every figure shows whether it comes from the supplier’s own data or from an average factor, which tells the team where to ask for primary data.

Which retail systems feed CarbonOS, and how is the audit trail kept?

Up arrow icon

CarbonOS reads ERP systems such as SAP or Oracle, invoices, energy meters and IoT data from stores and the cold chain, plus TMS and WMS data from logistics, then normalises and versions everything. Each value keeps its lineage back to the source invoice or meter, a versioned emission factor and a change history, in line with the ISO 14064-3 verification standard, which supports both disclosures and environmental claims.

[our blog]
Retail & Sustainability: News and Analysis.
Follow the latest trends in retail sustainability, carbon regulations, and innovations for low-impact retail operations. Our blog delivers in-depth analysis to help your chain stay competitive and sustainable.
LNG plant on the Burrup Peninsula in the Pilbara at blue hour, seen from red boulders and spinifex (AI-generated illustration)
Regulation
02 Nov 26
Safeguard Review: Is an Australian CBAM Coming?
Right arrow iconRight arrow icon
Minerals processing plant in the Pilbara with an adjacent solar farm and battery storage containers on red earth (AI-generated illustration)
News
18 Oct 26
How AI Cuts Costs and Creates New Revenue for Australian Heavy Industry: The 2026 Numbers
Right arrow iconRight arrow icon
LNG plant on the Burrup Peninsula in the Pilbara at blue hour, seen from red boulders and spinifex (AI-generated illustration)
Guide
30 Sep 26
AASB S2 and the Safeguard Mechanism: Emissions Data You Need
Right arrow iconRight arrow icon