[LOGISTICS SECTOR]

Optimise your logistics with precise fleet monitoring. Innovate with CarbonOS.
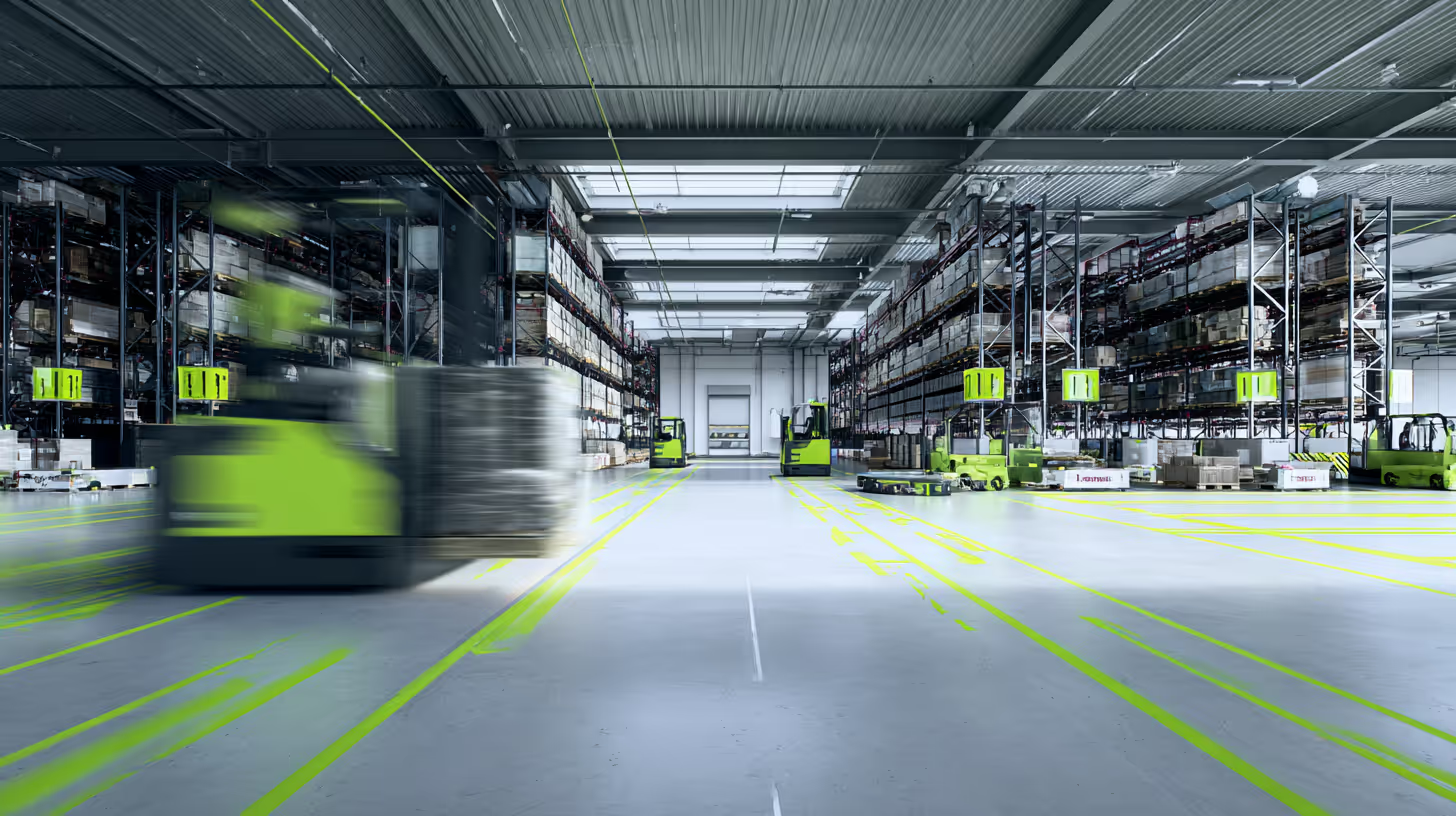
With CarbonOS, we deliver the data intelligence your logistics company needs to optimise routes, reduce costs, and stand out in an increasingly competitive market.
our expertise
our expertise
PROGRAMS & TECHNOLOGY PARTNERS
15
specialised AI agents — from an auditable GHG inventory to carbon per route, fleet, and shipment, in a single pipeline.
[APPLIED EFFICIENCY]
CarbonOS: AI-native infrastructure for fleet and logistics decarbonisation.
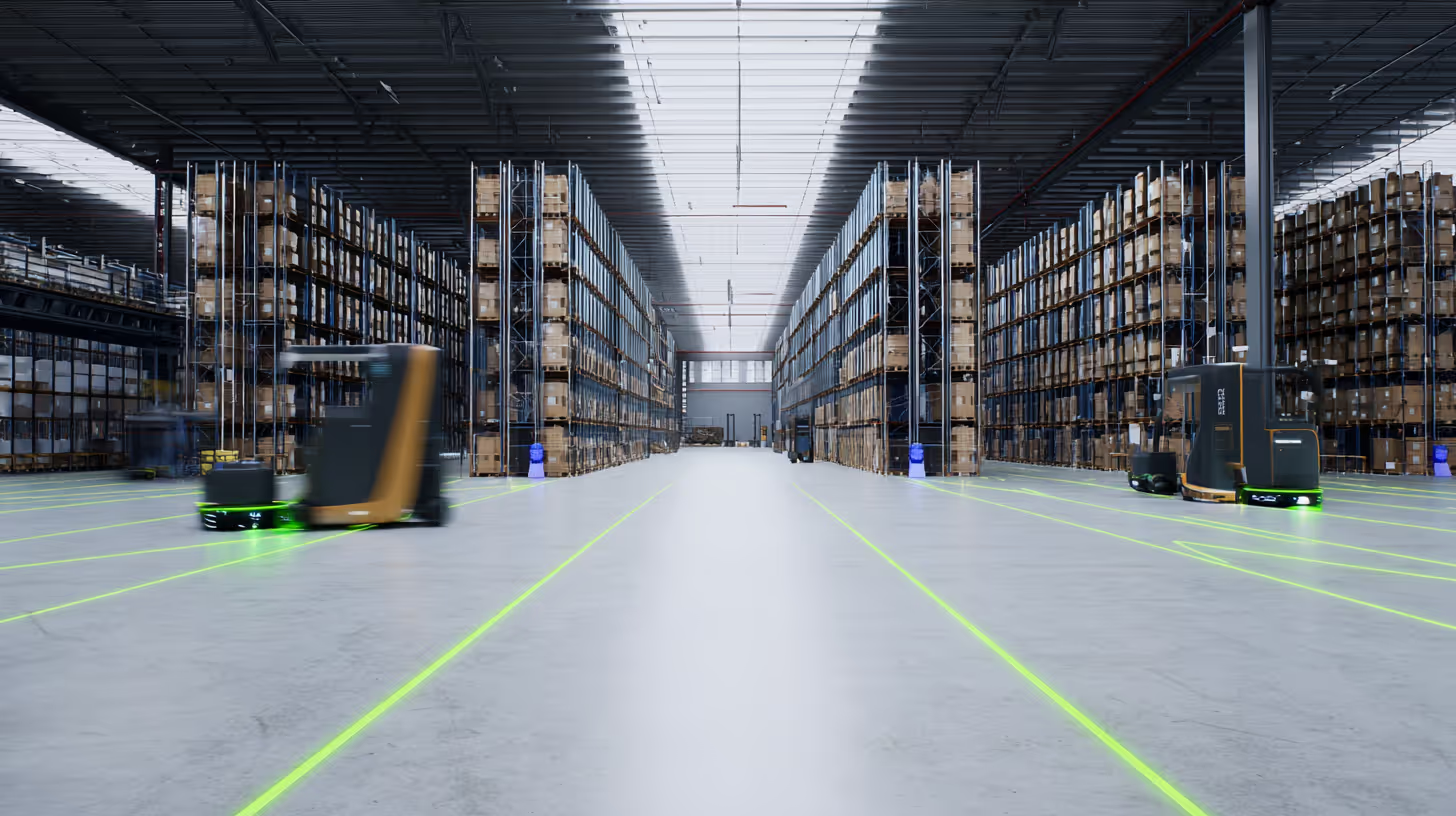
CarbonOS monitors the performance of your entire fleet in real time, from warehouse to delivery. The platform delivers insights for optimising routes, managing field teams, and generating performance reports.
Right arrow iconRight arrow icon
our process
Fleet Management
Cost Control
Quality and Traceability
Supply Chain
[OUR PURPOSE]
Accelerating the digital transformation of the logistics sector with technology, data, and market intelligence.
Right arrow iconRight arrow icon
our partners
[OUR SOLUTIONS]
Customised solutions for logistics sector challenges.
Our specialists work with your team to implement CarbonOS, adapting the platform to your operation’s specific needs. From route data analysis to integration with existing systems, we offer a complete solution for fleet management.
Route Optimisation
Delivery Management
Smart Fleets
Performance Reports
Delivery Cycle Analysis
Automated inventory icon
Regulatory Compliance
sustainable
logistics
carbonova systems
Scope 3 emissions
Companies and partners that trust Carbonova
[Frequently asked questions]

Low-carbon logistics with AI: frequently asked questions

Short answers on fuel, shipment emissions and carbon rules in logistics. To see them worked out with your own fleet data, book a demo.

Right arrow iconRight arrow icon
book a demo

How does Carbonova help a logistics operation cut costs and emissions?

Up arrow icon

Carbonova connects fuel purchases, TMS trip data, WMS warehouse activity and vehicle telemetry to CarbonOS, a platform of AI agents that calculates fuel use and emissions per route, vehicle, customer and shipment, flags drift in consumption and compares measures such as routing, modal shift and lower-carbon fuels by their effect on cost and CO₂. The same dataset produces the Scope 1 to 3 inventory and the shipment-level emissions data customers ask for.

Where do the emissions of a logistics operation come from?

Up arrow icon

Mostly from burning diesel and other fuels in trucks, ships, aircraft and trains, with a smaller share from the energy used in warehouses and terminals. Transport produced about 15% of global net greenhouse gas emissions in 2019 (IPCC, 2022), and trucks account for about a third of road transport emissions (IEA, 2025). Empty running, idling and poorly loaded trips are where fuel, and money, is lost.

Which carbon rules apply to freight and logistics companies in Australia?

Up arrow icon

Large companies report under AASB S2, which requires Scope 1, 2 and 3 emissions; Group 2 entities started with reporting periods beginning on or after 1 July 2026, and a shipper’s Scope 3 includes the freight it buys. Transport facilities that emit more than 100,000 tCO₂e a year are also covered by the Safeguard Mechanism, whose baselines fall by 4.9% a year to 30 June 2030.

Can a large Australian freight fleet earn Safeguard Mechanism Credits?

Up arrow icon

Yes, if it is a Safeguard facility. A covered transport facility that cuts its emissions below its baseline is issued one Safeguard Mechanism Credit for each tonne of CO₂e below it, which it can sell to other covered facilities or keep for its own compliance; they are not offsets. Carbonova tracks fleet emissions against the baseline from fuel and telemetry data and ranks measures such as routing, fuel switching and electric trucks by credits created per dollar.

How does Carbonova calculate emissions per shipment for customers’ Scope 3 reports?

Up arrow icon

The supply chain agent calculates the logistics emissions of each shipment from trip, fuel and load data, so a carrier can give every shipper the emissions of its own freight, which the shipper reports under Scope 3 categories 4 and 9 of the GHG Protocol. The same agent rates subcontracted carriers with supplier scorecards, so outsourced legs are counted with the same method as the carrier’s own fleet.

Which logistics systems does Carbonova connect to, and is the data audit-ready?

Up arrow icon

CarbonOS connects to TMS and WMS platforms, vehicle telemetry and IoT devices, invoice data and ERP systems such as SAP or Oracle, then normalises and versions the data. Every emissions figure keeps its lineage back to the trip or invoice, the version of the emission factor used and a change history, in line with the ISO 14064-3 verification standard, so customer reports and disclosures can be checked line by line.

[our blog]
Logistics & Fleets: News and Analysis.
Follow the latest trends in fleet management technologies, regulations, and innovations for the logistics sector. Our blog delivers in-depth analysis to help your company stay ahead on the path to efficiency.
LNG plant on the Burrup Peninsula in the Pilbara at blue hour, seen from red boulders and spinifex (AI-generated illustration)
Regulation
02 Nov 26
Safeguard Review: Is an Australian CBAM Coming?
Right arrow iconRight arrow icon
Minerals processing plant in the Pilbara with an adjacent solar farm and battery storage containers on red earth (AI-generated illustration)
News
18 Oct 26
How AI Cuts Costs and Creates New Revenue for Australian Heavy Industry: The 2026 Numbers
Right arrow iconRight arrow icon
LNG plant on the Burrup Peninsula in the Pilbara at blue hour, seen from red boulders and spinifex (AI-generated illustration)
Guide
30 Sep 26
AASB S2 and the Safeguard Mechanism: Emissions Data You Need
Right arrow iconRight arrow icon