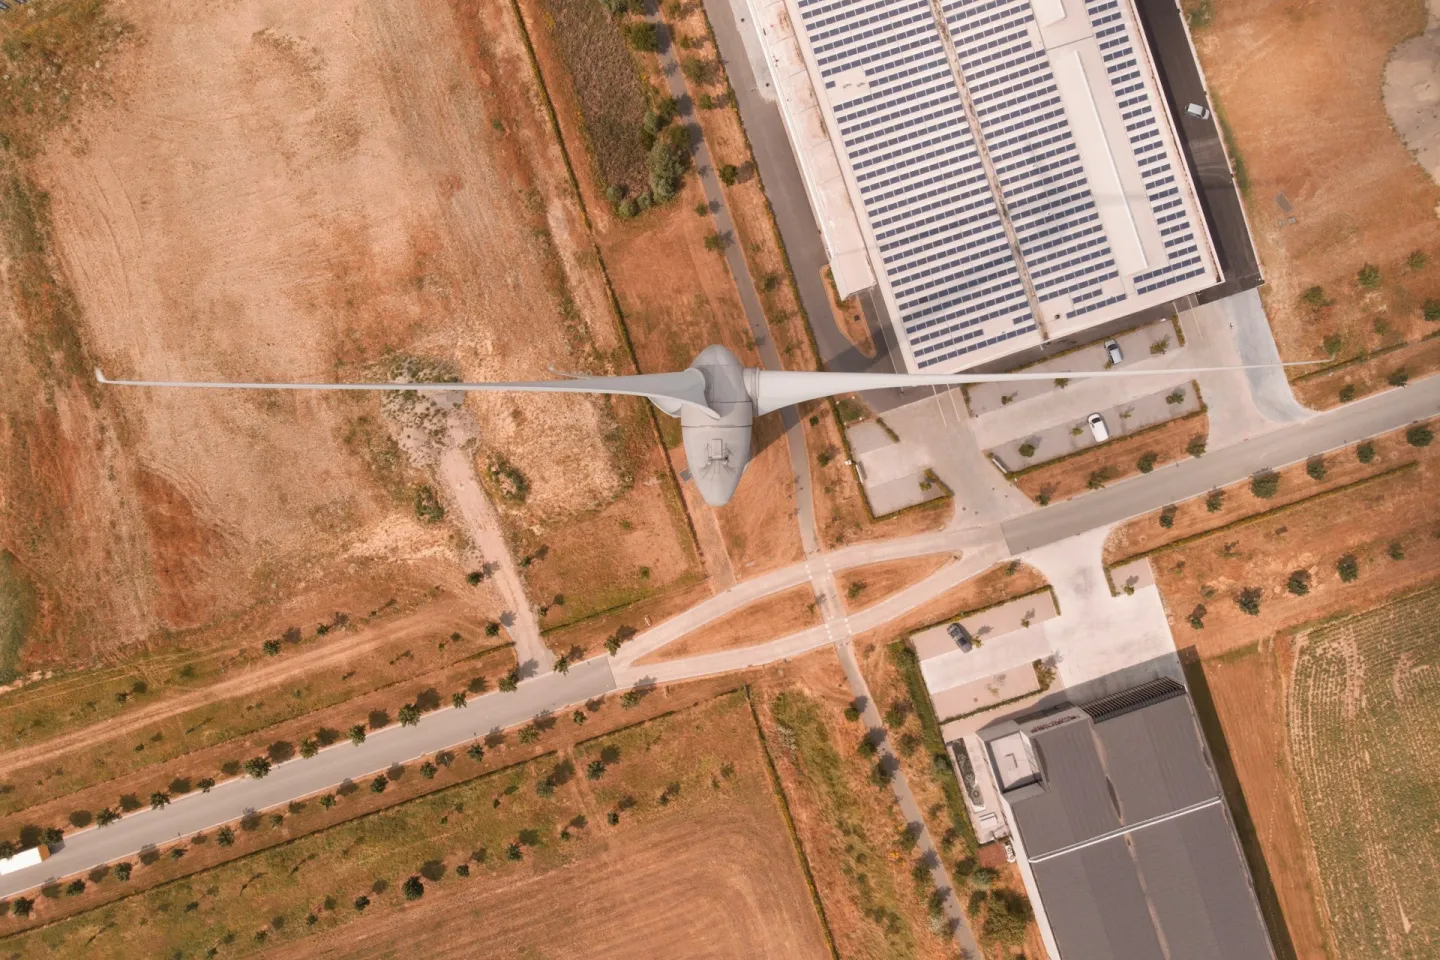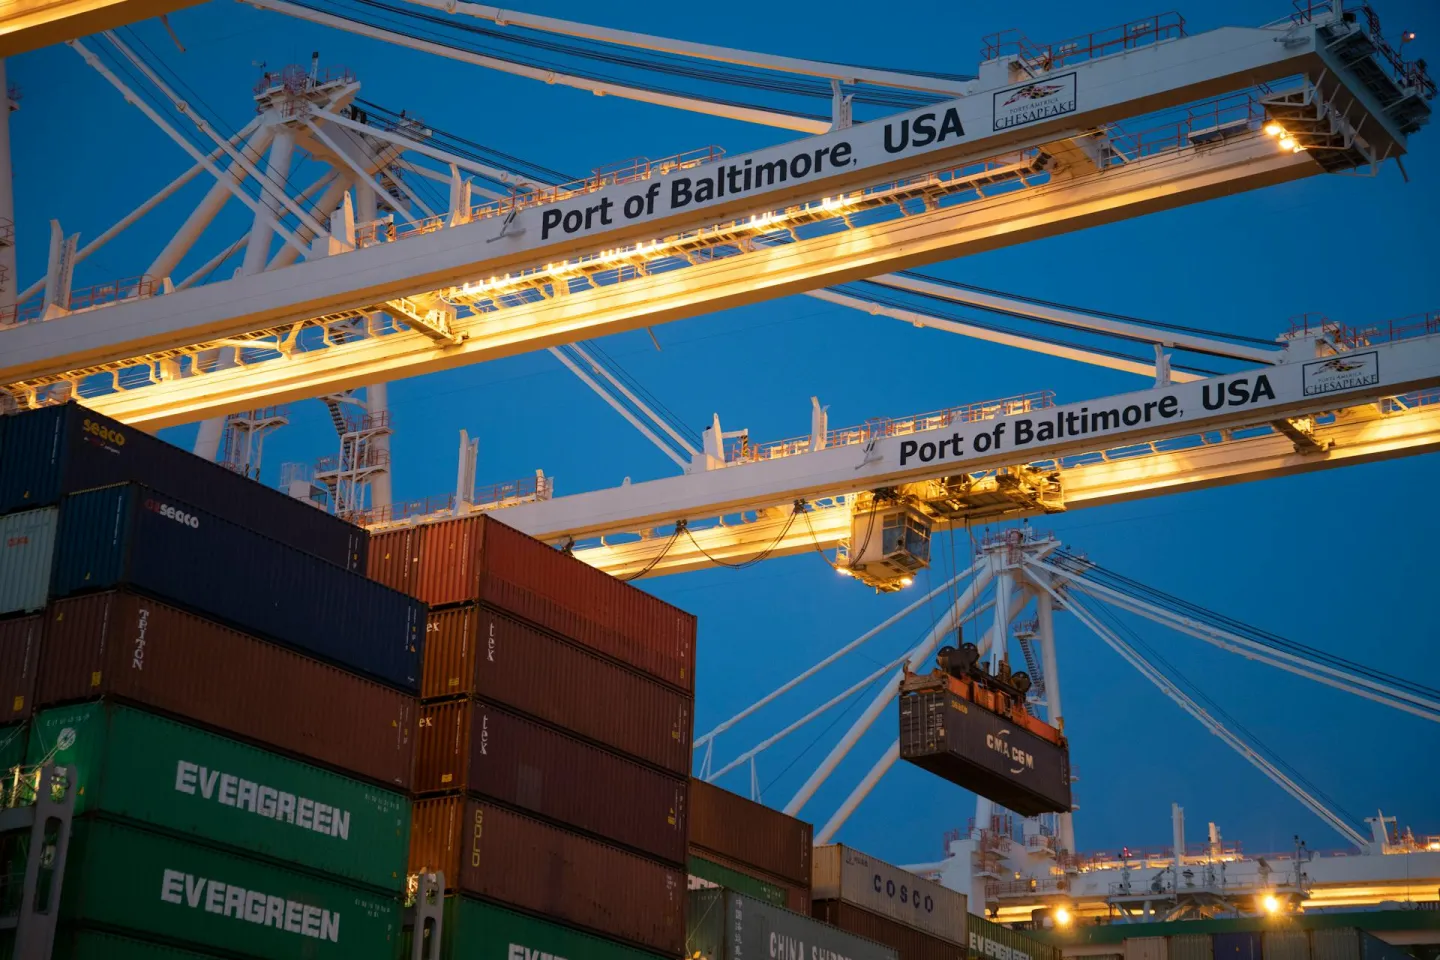


The single source of truth for your assets: hierarchy, operational boundaries and causal relationships in one canonical digital twin.
Plants, lines, utilities and meters become a single graph — ownership, boundaries and accountable teams defined once.
Energy, process and emissions data flow over the same hierarchy, with explicit causal relationships and 3D visualisation.
From GHG inventory to Net Zero planning, every agent uses the same auditable hierarchy — and it scales to operations of any size.
Straight answers about Asset Graph, the CarbonOS digital twin of assets, processes and energy flows. To see your plant mapped, book a demo.
Asset Graph is the digital twin in CarbonOS: a graph model of an operation’s physical assets, processes and energy flows, with the hierarchy of plants, lines, utilities and meters, ownership, operational boundaries and the causal relationships between them. It is the common reference every agent on the platform uses to know where energy is used and where each emission occurs.
It is for process engineers, operations and maintenance teams, and asset and energy managers who need to see how much each piece of equipment weighs on energy use and the carbon footprint. It solves a common problem in industrial groups: every system describes assets differently, so adding up emissions by plant, line or equipment with confidence is hard.
It starts from the records and signals that already exist: the asset register in the ERP and maintenance system (CMMS), SCADA tags, energy meters and IoT data, received through Signal Ingest. Plants, lines, utilities and meters become nodes in a graph, and energy and material flows become the links between them. Changes in the source systems are synced and versioned.
The GHG Protocol requires companies to consolidate emissions by equity share or by financial or operational control, and to apply the chosen approach at every level of the organisation (WRI and WBCSD, 2004). Asset Graph records the ownership and control of each asset, so emissions can be consolidated under the chosen approach and each source assigned to Scope 1, 2 or 3 without rebuilding the asset register.
Signal Ingest feeds the graph with clean data; Carbon Intelligence uses the hierarchy to assign every emission to an asset and a business unit; Sentinel AI places each anomaly on the right piece of equipment; and Decarbonization Planner simulates measures on the same model. Versions of the hierarchy are recorded in Proof Engine, so the verifier can see which boundaries applied to each inventory.
Yes. The graph represents the whole operation, with several plants, lines, utilities and meters in one hierarchy and ownership, boundaries and accountable teams defined once. That makes it possible to see energy use and emissions by plant, business unit or piece of equipment and to consolidate the group without parallel spreadsheets. The first mapping starts from the records and signals the company already has.