[CHEMICAL INDUSTRY]

Produce low-carbon chemicals with precise monitoring. Optimise with CarbonOS.

With CarbonOS, Carbonova delivers the data intelligence your chemical or petrochemical plant needs to reduce emissions, optimise energy consumption, and stand out in an increasingly competitive and regulated market.
our expertise
our expertise
PROGRAMMES & TECHNOLOGY PARTNERS
15
specialised AI agents — from an auditable GHG inventory to decarbonising chemical and petrochemical processes, in a single pipeline.
[APPLIED EFFICIENCY]
CarbonOS: AI-native infrastructure for decarbonising chemicals and petrochemicals.
CarbonOS monitors emissions in real time across every process in your plant, from raw materials to finished product. The platform delivers insights for switching to cleaner energy sources, optimising processes, and generating compliance reports.
Right arrow iconRight arrow icon
our process
Process Efficiency
Energy Source Management
Compliance and Reporting
Sustainable Value Chain
[our purpose]
Accelerating the chemical and petrochemical industry’s transition to a low-carbon future with technology, data, and market intelligence.
Right arrow iconRight arrow icon
our partners
[OUR SOLUTIONS]
Customised solutions for chemical and petrochemical industry emissions challenges.
Our specialists work with your team to implement CarbonOS, adapting the platform to your operation’s specific needs. From production data analysis to integration with existing systems, we offer a complete solution for emissions management.
Reactor Optimisation
Process Electrification
Carbon Capture and Utilisation (CCU)
Sustainability Reports
Life Cycle Assessment
Automated inventory icon
Regulatory Compliance
operational
efficiency
carbonova systems
CBAM compliance
Companies and partners that trust Carbonova
[Frequently asked questions]

Low-carbon chemicals with AI: frequently asked questions

Short answers on process heat, feedstocks, costs and carbon rules in chemical plants. To see them worked out with your own plant data, book a demo.

Right arrow iconRight arrow icon
book a demo

How does Carbonova help a chemical plant cut costs and emissions?

Up arrow icon

Carbonova connects reactor, furnace, boiler, utilities and energy data to CarbonOS, a platform of AI agents that calculates emissions by unit and by product, flags drift in steam, gas and electricity use, and ranks scenarios by cost per tonne of CO₂ avoided. Carbonova Build, in early access, adds process simulation with pinch analysis, advanced process control and soft sensors.

Where do a chemical plant’s emissions come from?

Up arrow icon

Mostly from burning fuel for process heat and steam, from reactions that release CO₂ or N₂O, as in ammonia and nitric acid production, and from purchased electricity. Chemicals are the largest industrial energy consumer, and more than half of the energy the sector takes in is used as feedstock rather than fuel (IEA, 2018).

Which carbon rules apply to chemical plants in the UK?

Up arrow icon

Ammonia and nitric acid plants, hydrogen production above 25 tonnes a day and bulk organic chemicals above 100 tonnes a day are covered by the UK Emissions Trading Scheme. The UK Low Carbon Hydrogen Standard sets the bar for low-carbon hydrogen at 20 gCO₂e per MJ or less and counts methane released at the plant. UK-listed groups report against UK SRS on a comply-or-explain basis from 2027 (FCA, 2026).

Does the UK CBAM change the economics of UK ammonia, fertiliser and hydrogen?

Up arrow icon

Yes. From 1 January 2027 the UK CBAM puts a carbon price on imported fertiliser and hydrogen, and free UK ETS allocation for those goods starts to phase out from 2027, so UK producers and importers move towards the same carbon cost. That makes each tonne of CO₂ avoided worth more to a UK plant. Carbonova ranks fuel, feedstock and heat-recovery measures by cost per tonne avoided on the plant’s real data.

How does Carbonova help recover heat and cut steam use in a chemical plant?

Up arrow icon

Using the plant’s real data, Carbonova Build runs pinch analysis on heat exchange and shows where rejected heat could preheat feeds or raise steam, and the CarbonOS planning agent ranks the options by cost per tonne of CO₂ avoided. The room is often large: between 20% and 50% of industrial energy input in the United States is lost as waste heat (US Department of Energy, 2008).

How do you calculate the carbon footprint of each product in a multi-product chemical plant?

Up arrow icon

Asset Graph builds a digital twin of units, streams and energy flows, so Carbon Intelligence can assign steam, electricity and feedstock emissions to each product, using data from SCADA, meters and ERP systems such as SAP or Oracle. Proof Engine keeps the lineage and versioned emission factor behind every number, in line with the ISO 14064-3 verification standard, for customers and verifiers.

[our blog]
Chemicals & Petrochemicals: News and Analysis.
Follow the latest trends in decarbonisation technologies, regulations, and innovations for the chemical and petrochemical industry. Our blog delivers in-depth analysis to help your company stay ahead on the path to sustainability.
Aerial view of a production site with solar roofs in front of an Alpine panorama (AI-generated illustration)
Guide
11 Nov 26
CO₂ Act, ETS and climate reporting: a guide for Swiss industrial companies
Right arrow iconRight arrow icon
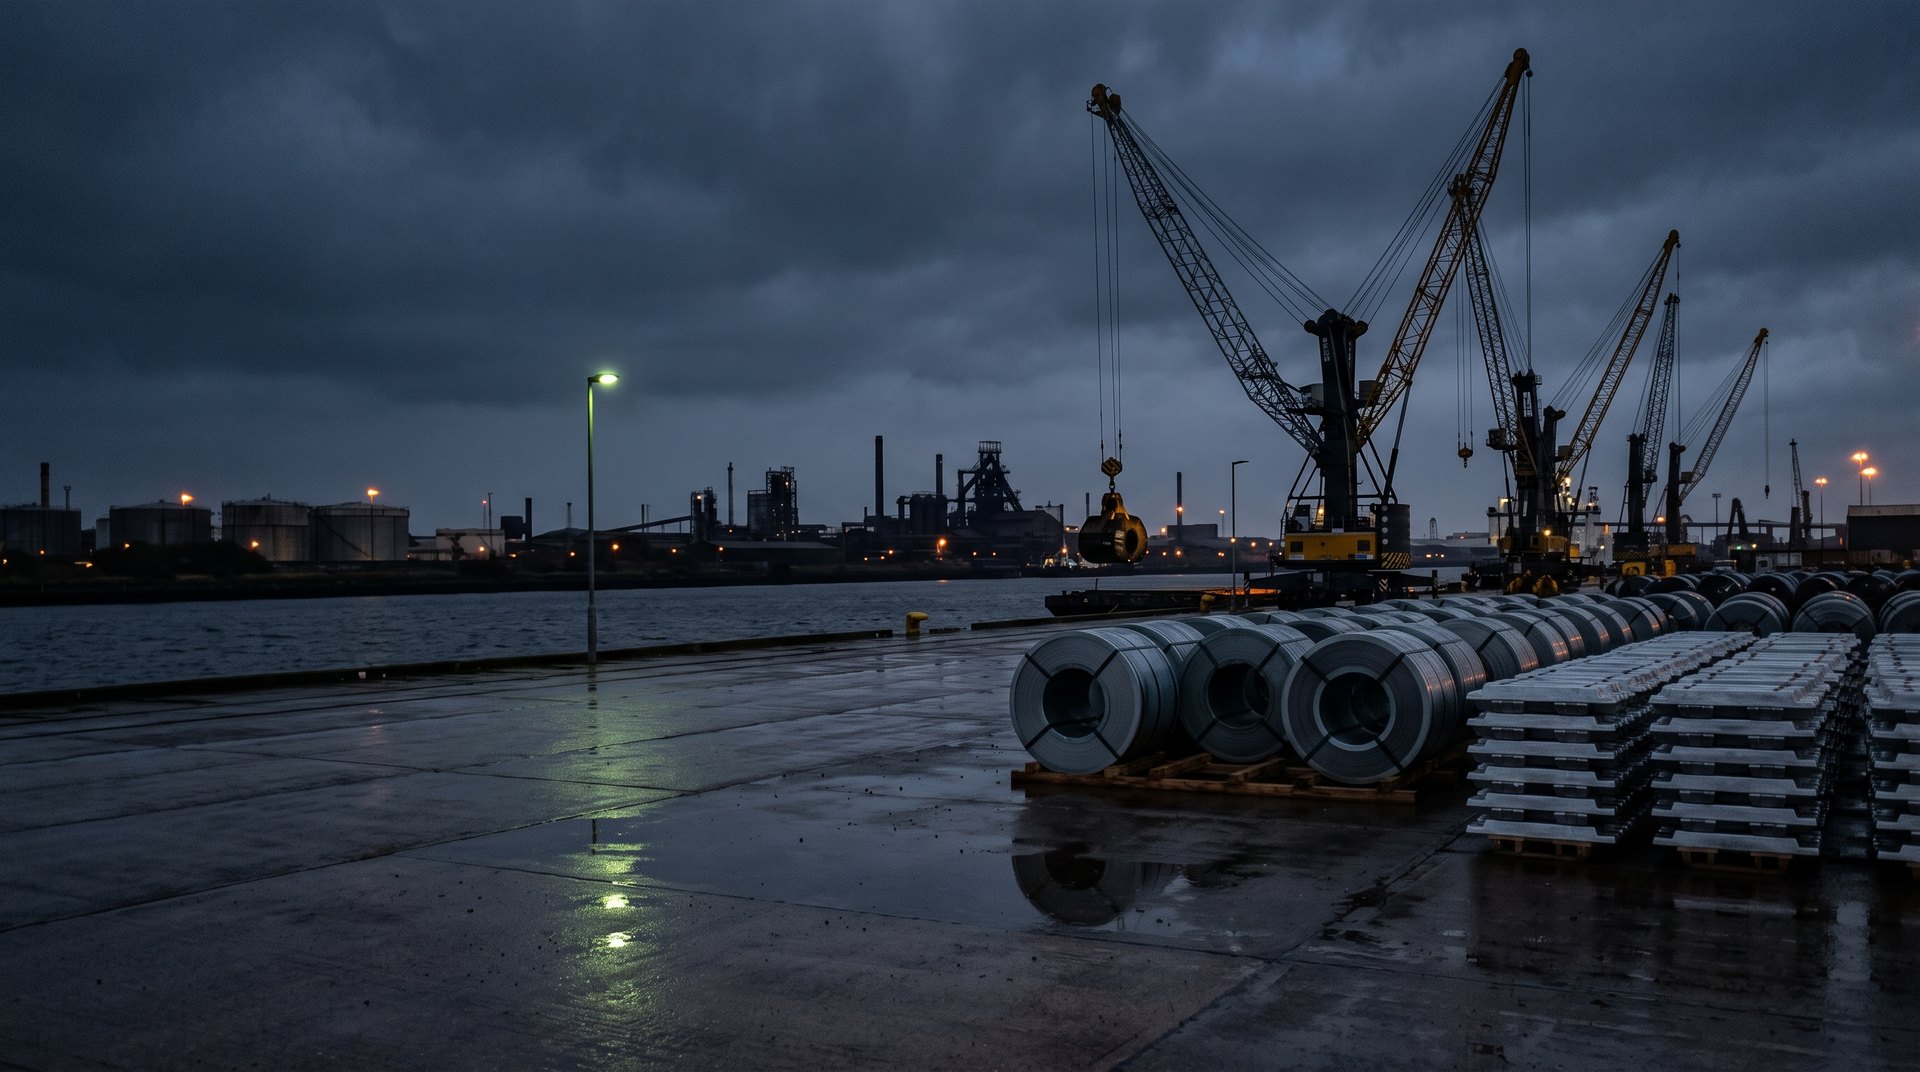
Imported steel coils and aluminium ingots on a Teesside quay at dusk, with cranes and industrial plant behind
Regulation
02 Nov 26
UK–EU Carbon Market Link: What It Means for CBAM
Right arrow iconRight arrow icon
Chemical plant on a northern England estuary in the early morning, with pipe racks, a heat recovery unit and mudflats (AI-generated illustration)
News
18 Oct 26
How AI Cuts Costs and Creates New Revenue for UK Heavy Industry: The 2026 Numbers
Right arrow iconRight arrow icon