[INDUSTRIES WE SERVE]

Monitor Oil & Gas
emissions with precision. Optimise with CarbonOS.

With CarbonOS, Carbonova delivers precise emissions monitoring for the Oil & Gas sector, ensuring regulatory compliance and paving the way for cleaner, more profitable operations.
our expertise
our expertise
PROGRAMMES &
TECHNOLOGY PARTNERS
Cutting methane intensity — an IEA priority
With CarbonOS in place, we turn environmental liabilities into strategic assets.
[APPLIED EFFICIENCY]
CarbonOS: AI-native infrastructure for emissions management in Oil & Gas.
CarbonOS centralises emissions data from every source, from exploration to refining. The platform delivers actionable insights to reduce your carbon footprint, optimise processes, and give stakeholders full transparency.
Right arrow iconRight arrow icon
our process
Continuous Monitoring
Reporting and Compliance
Emissions Reduction
Increased Asset Value
[our purpose]
Helping the Oil & Gas sector transition to a low-carbon economy with technology and data intelligence.
Right arrow iconRight arrow icon
our partners
[our purpose]
Customised solutions for Oil & Gas emissions challenges.
Our specialists work alongside your team to implement CarbonOS, adapting the platform to your operation’s specific needs. From field measurement to data analysis, we offer a complete solution for emissions management.
Fugitive Emissions (process data)
Flare Monitoring
Transport and Refining
Sustainability Reports
Process Optimisation
Automated inventory icon
Regulatory Compliance
continuous
monitoring
carbonova systems
regulatory compliance
Companies and partners that trust Carbonova
[Frequently asked questions]

Oil & Gas emissions with AI: frequently asked questions

Short answers on flaring, methane, costs and carbon rules in oil and gas. To see them worked out with your own operating data, book a demo.

Right arrow iconRight arrow icon
book a demo

How does Carbonova help an oil and gas operation cut costs and emissions?

Up arrow icon

Carbonova connects SCADA, flow-metering and energy data to CarbonOS, a platform of AI agents that calculates emissions by source (combustion, flaring, venting, and fugitives estimated from process data), flags drift and ranks measures by cost per tonne of CO₂ avoided. Carbonova Sense, now at pilot stage, infers a flare’s combustion state on the asset itself. The same dataset feeds GHG Protocol, ISSB-aligned and customer reporting, with an audit trail back to the source.

Where do emissions and gas losses come from in oil and gas operations?

Up arrow icon

The largest sources are fuel burned for power and gas compression, flaring, and methane released through venting and leaks. The world flared 167 billion cubic metres of gas in 2025, the third annual increase in a row (World Bank, 2026). And around 70% of methane emissions from fossil fuels could be cut with technology that already exists (IEA, 2026).

Which methane and carbon rules apply to oil and gas operators in the EU?

Up arrow icon

The EU Methane Regulation bans routine venting and flaring, requires new flare stacks to have an auto-igniter or continuous pilot and a design destruction efficiency of at least 99%, and required the first verified source-level reports by 5 February 2026. Refineries are outside it: their flaring falls under the refining best-practice conclusions, and their CO₂ under the EU ETS, which also covers combustion plant above 20 MW.

What does a tonne of CO₂ cost an EU refinery or gas processing plant?

Up arrow icon

Installations in the EU Emissions Trading System, which includes refineries and combustion plant above 20 MW, surrender one allowance per tonne of CO₂, and EU ETS auction prices averaged €82.32 per tonne in the third quarter of 2026. Every tonne avoided by recovering flare gas or cutting fuel use saves that cost, and the recovered gas can be sold. Carbonova ranks those measures by cost per tonne avoided.

How does Carbonova Sense help control flaring?

Up arrow icon

Sense, now at pilot stage, runs on the asset and combines radiometric LWIR thermal imaging, RGB vision and an acoustic proxy to infer the flare’s state: lit and normal, smoking, degraded, flameout, venting or no flow. Operators see at once when the flame goes out or combustion degrades. Vented methane is quantified only for confirmed venting, from SCADA flow data. Sense is not a methane sensor and does not detect leaks.

Will oil and gas methane and flaring data stand up to auditors and buyers?

Up arrow icon

Yes. Every value has lineage back to its source in SCADA, ERP systems such as SAP or Oracle, or meters, plus a versioned emission factor and a change history, in line with the ISO 14064-3 verification standard. That matters because methane reporting is moving from estimates to measurement: OGMP 2.0, the industry’s reference framework, has 153 member companies covering 42% of global oil and gas production (UNEP, 2025).

[our blog]
Oil & Gas: News and Analysis.
Follow the latest trends, technologies, and regulations for emissions management in the Oil & Gas sector. Our blog delivers in-depth analysis to help your company navigate the energy transition.
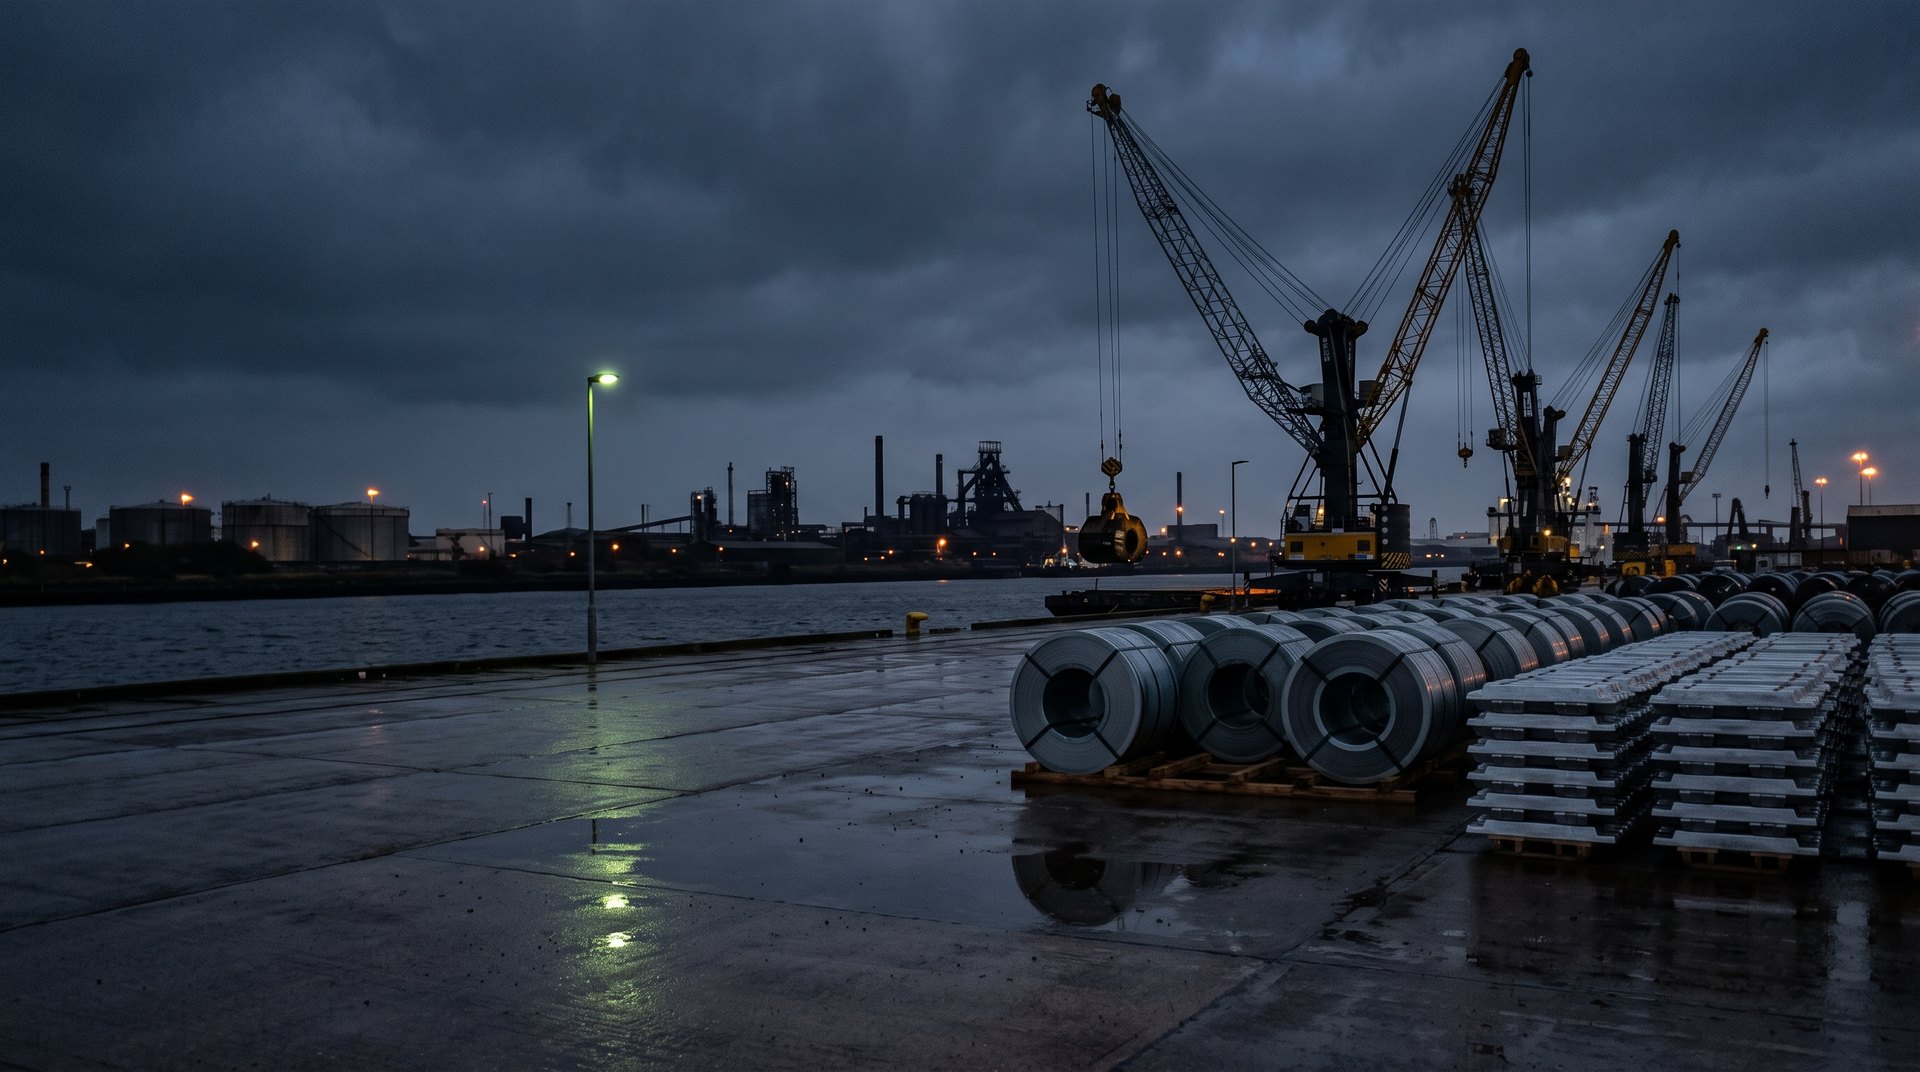
Imported steel coils and aluminium ingots on a Teesside quay at dusk, with cranes and industrial plant behind
Regulation
02 Nov 26
UK–EU ETS Link: What Changes for Irish Importers
Right arrow iconRight arrow icon
Anaerobic digesters and a biomethane upgrading unit beside a dairy processing plant in County Cork countryside (AI-generated illustration)
News
18 Oct 26
How AI Cuts Costs and Creates New Revenue for Irish Industry: The 2026 Numbers
Right arrow iconRight arrow icon
Container crane and ferry at Dublin Port at dusk, with the twin chimneys in the distance (AI-generated illustration)
Guide
30 Sep 26
Authorised CBAM Declarant: How to Apply in Ireland (2026 Guide)
Right arrow iconRight arrow icon