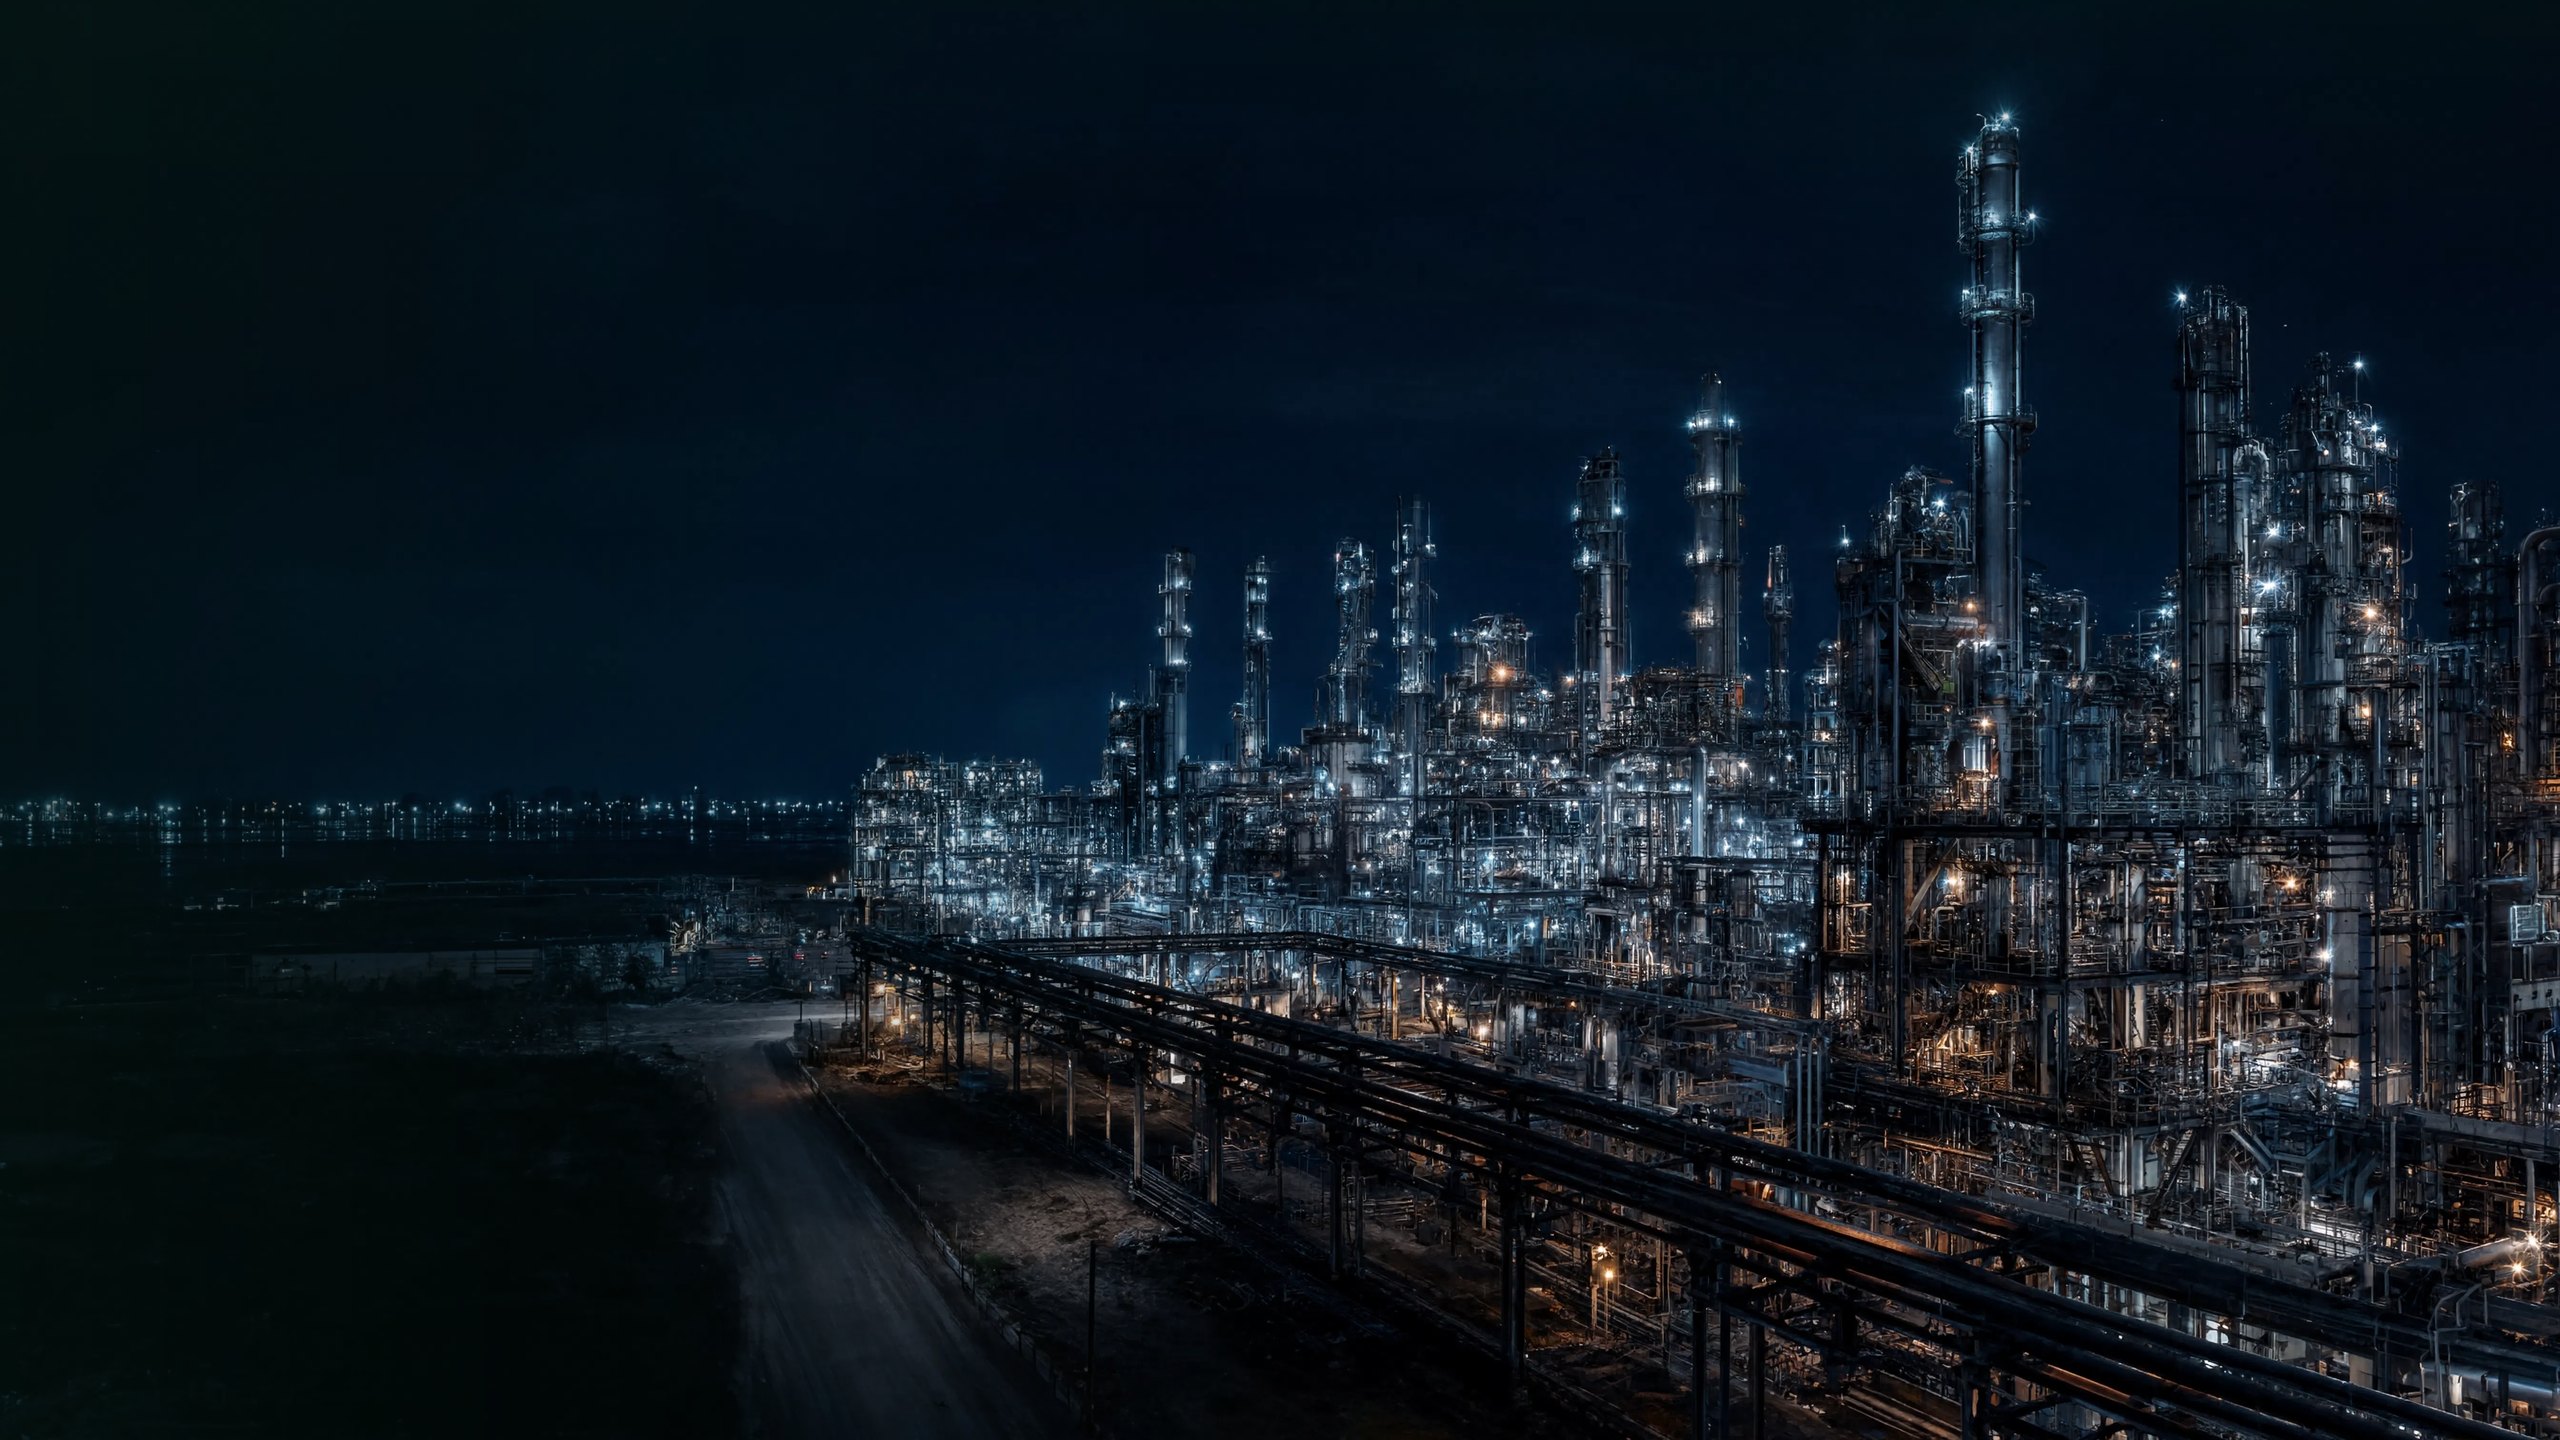
Planta petroquímica iluminada à noite vista do alto, gêmeo digital de ativos industriais

Asset Graph.

A canonical digital twin of physical assets, processes, and energy flows. The single source of truth for asset hierarchy, ownership, operational boundaries, and causal relationships — continuously synced with your OT and ERP systems.
[What it is]
The single source of truth for your industrial assets.
Ícone inventário automatizado
Canonical Digital Twin
Maps thousands of assets and tens of thousands of relationships between them in real time. It serves as the single source of truth that feeds every other module on the platform.

‍
Real-Time Synchronisation
Continuous synchronisation with plant operating systems, ensuring asset changes are instantly reflected in emissions modelling.
Ícone compliance regulatório
Visual & Exploratory Navigation
Enables visual and exploratory navigation through asset dependencies, revealing emission bottlenecks and efficiency opportunities.
Hierarchy & Operational Boundaries
Defines and maintains asset hierarchy, ownership, operational boundaries, and causal relationships across all operational elements.

No items found.
“Fragmented asset data across ERPs, SCADA, CMMS, and spreadsheets is the root cause of unreliable emission inventories in heavy industry — most organisations can’t even answer ‘which assets do we own, where, and what do they emit?’ with confidence.”
Industrial Digital Twin
Asset hierarchy · ownership · boundaries
Scopes 1–3
Asset-level boundary definition across all three emission scopes, with ownership and operational control modelled per GHG Protocol rules.
SCADA+ERP
Continuous sync with operational (SCADA, CMMS) and enterprise (ERP, asset registry) systems — no static snapshots.
Seta para direitaSeta para direita
learn more
Consultor de sustentabilidade da equipe CarbonovaIndústria monitorada por sistema de gestão de carbono CarbonOSLogística sustentável e transporte de baixo carbonoEquipe corporativa em reunião sobre compliance climáticoEspecialista em sustentabilidade analisando dados de emissões de carbono
[WHO IT’S FOR]
The Asset Graph is essential for process engineers, industrial operations teams, and asset managers who need full visibility into how each operational component impacts the carbon footprint. It transforms complex infrastructure data into actionable intelligence.
Seta para direitaSeta para direita
learn more
[how it works]
Complete Industrial Asset Mapping.
Indústria monitorada por sistema de gestão de carbono CarbonOS
Operação industrial com gestão de carbono Carbonova
Ícone energia renovável
Creates a canonical digital twin of the entire operational infrastructure — physical assets, industrial processes, and energy flows.
Maps thousands of assets and tens of thousands of relationships in real time, functioning as the single source of truth.
Continuous synchronisation with operating systems, reflecting changes instantly in emissions modelling.
Equipe corporativa em reunião sobre compliance climático
solar
potential
freight &
logistics
[ON THE PLATFORM]

How it works in CarbonOS

The single source of truth for your assets: hierarchy, operational boundaries and causal relationships in one canonical digital twin.

01 · MODEL
One canonical graph of your operations

Plants, lines, utilities and meters become a single graph — ownership, boundaries and accountable teams defined once.

02 · SYNC
Real-time metrics on the graph

Energy, process and emissions data flow over the same hierarchy, with explicit causal relationships and 3D visualisation.

03 · FEED
Every agent, one source of truth

From GHG inventory to Net Zero planning, every agent uses the same auditable hierarchy — and it scales to operations of any size.

app.carbonova.ai · Asset Graph
Plant map · 10 zones (demo)
Mapped assets
148 nodes · 10 zones
Source of truth
single hierarchy · versioned
Causal relationships
● active
Visualisation
3D · real time
illustrative data from the demo environment
Digital twinAsset hierarchyCausal relationships3D visualisationSCADAIoT